


Function Charts
Enter your own function to view as a chart. This is great for:
- Forming technical indicators
- Back testing trading strategies
- Observing short-term arbitrage opportunities
Entering your own function to view as chart
To enter your function to view as chart:
- Click on the ƒ(x) function button, and a window will appear.
- Enter your function in the main function text box at the top of the window.
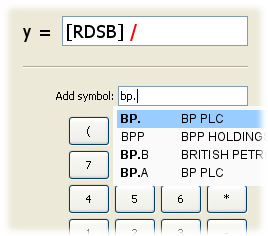
- To enter an instrument variable into the function, enter the instrument's symbol or name into the text box labelled 'Add Symbol:'.
- A popup will appear with a list of suggested instruments to select from.
- Select the instrument that you would like to enter into the function. The instrument will now appear in the function text box with brackets around it.
- You may enter operators (for example +,-,(,),*,/) directly into the function text box or by clicking on the relevant buttons.
- When you have completed entering the formula, make sure there are no errors. Any grammatical errors in the formula are highlighted in red.
- Once you are happy there are no errors, click the OK button.
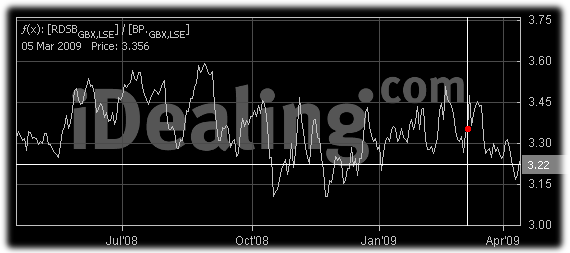
The function chart will begin loading and, once loaded, the function will be plotted.
Note - the loading time increases with the number of instruments present in the formula.