


Charting
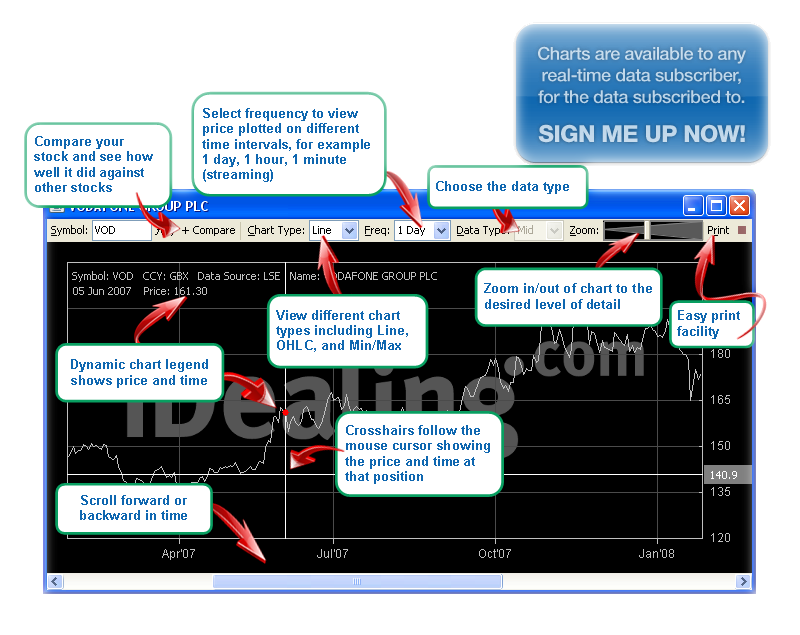
iDealing.com is proud to present our new interactive online chart application, which allows you to view historic daily charts as well as live, streaming intraday charts.
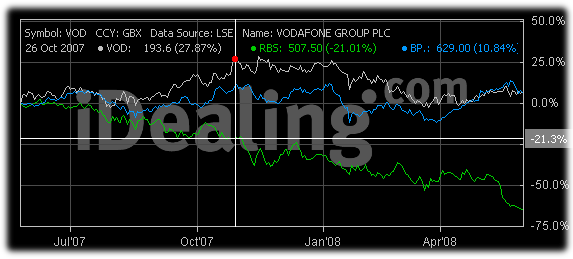
Comparisons ChartsCompare two or more securities. The price plot is automatically re-based as you zoom, scroll or resize the chart. The legend displays % performance as well as the price. |
 |
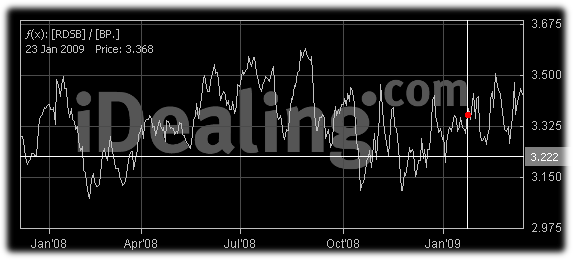 |
Function ChartsEnter your own function to view as chart.
|
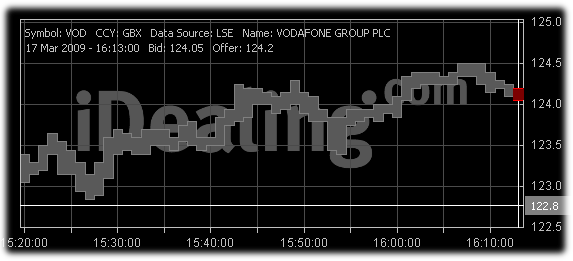
Min/Max ChartsGreat for illustrating the historical behaviour of the bid/offer spread. |
 |
Find out more about our charts!